Work Edge On Demand
A reporting framework so dashboards stopped breaking each other
Client activity dashboards built on a small internal framework, so a new report could not take down an existing one.
- Client
- Edge On Demand
- Role
- Developer
- Period
- 2015 to 2016
- Focus
- Development, Design
- MVP speed new reports built quickly
- Isolated reports cannot break each other
- Highcharts charting layer
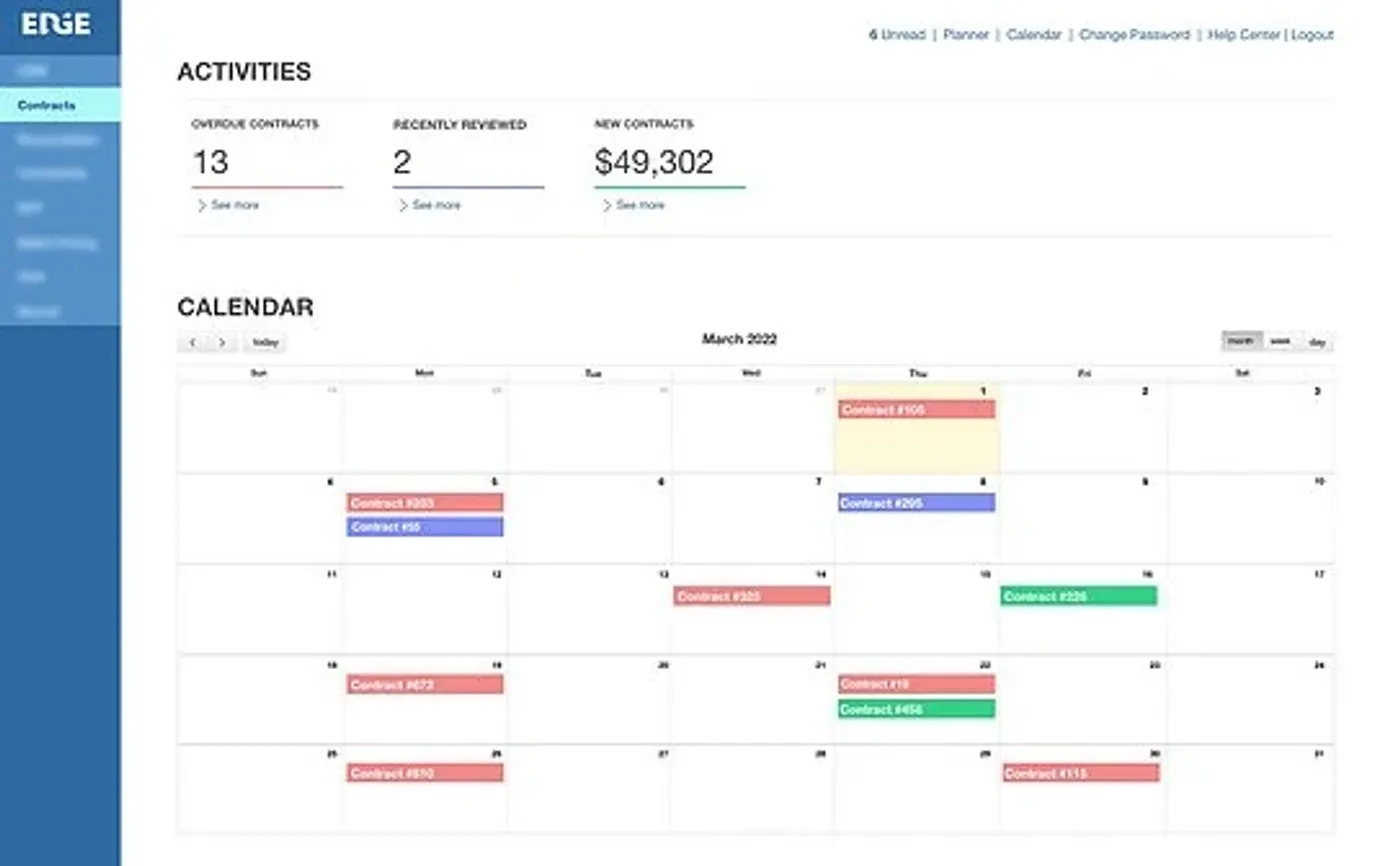
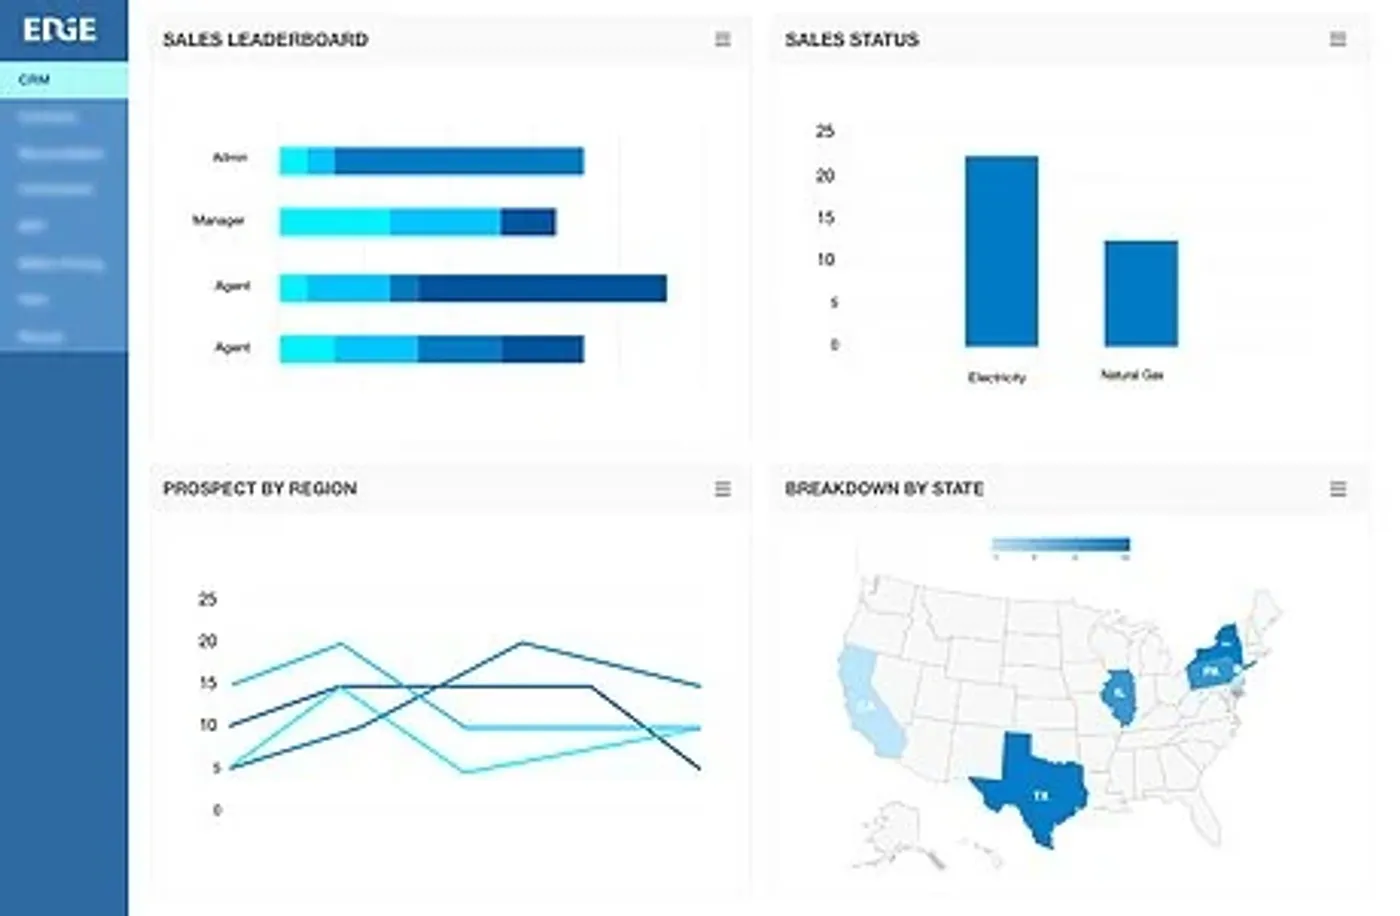
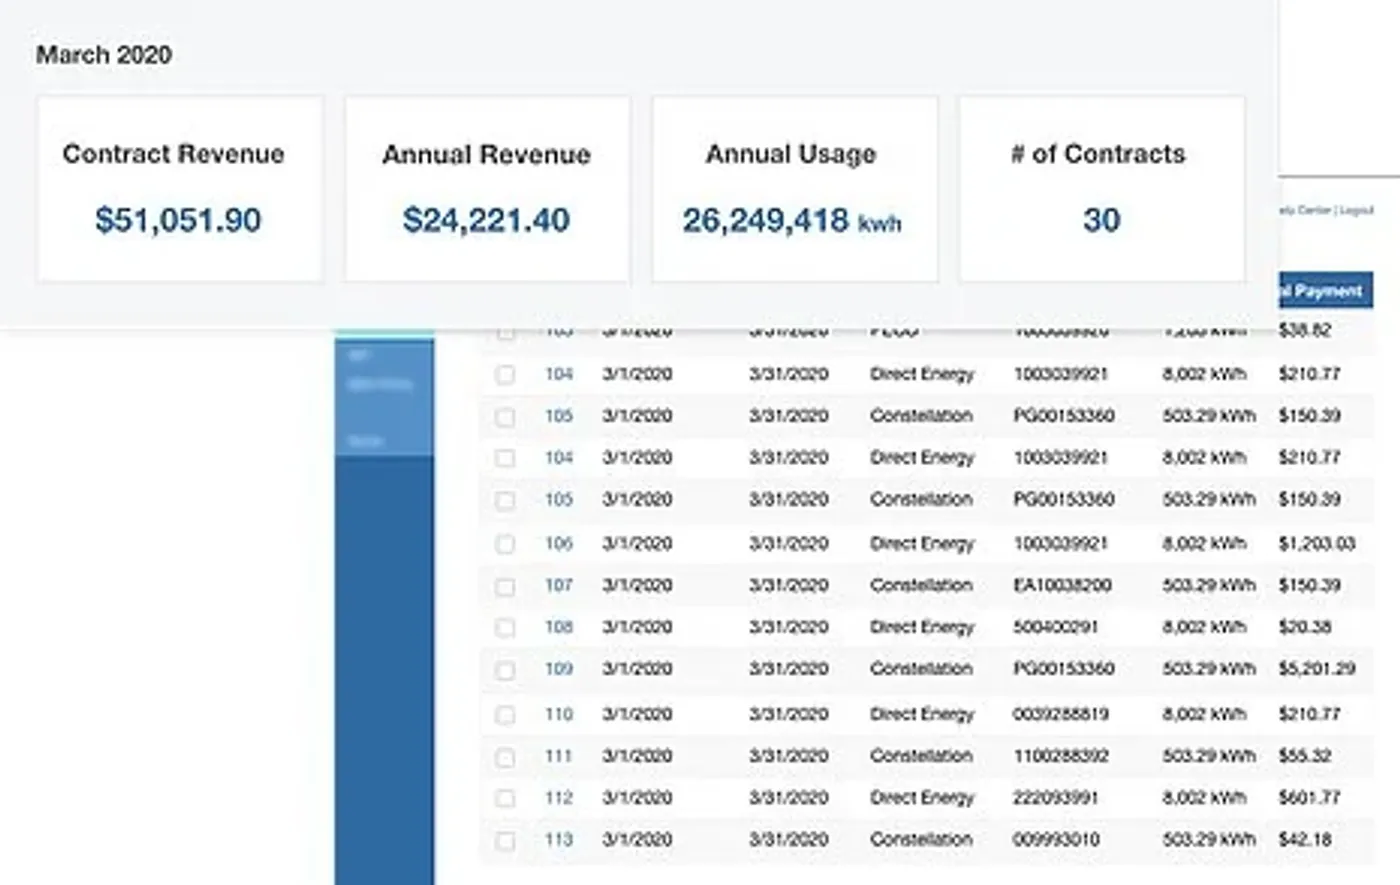
I worked with the business analysts to build dashboards showing a client’s overall activity across a business domain.
The interesting part was not any single dashboard. It was that we needed a lot of them, quickly, and the usual outcome of that is a pile of one-off reports where changing one breaks another.
A small framework instead
I built a mini reporting framework: API endpoints, chart object registration, and the frontend ajax logic to go with it. New reports got built fast, and each one stayed isolated from the others. The design borrowed heavily from Django’s forms architecture, which solves a structurally similar problem of declaring components and having the framework assemble them.
Highcharts did the charting.
Updated note. Approaching this today I would lean on Vue or HTMX, depending on where the team’s strengths actually sit.
Screens